The Instructional Designer's Toolkit
  • Blog
  • Portfolio

Tools and Inspiration
for Instructional Designers
​and eLearning Developers

By Bill Kemsley

Storytelling with Data

7/11/2018

0 Comments

 
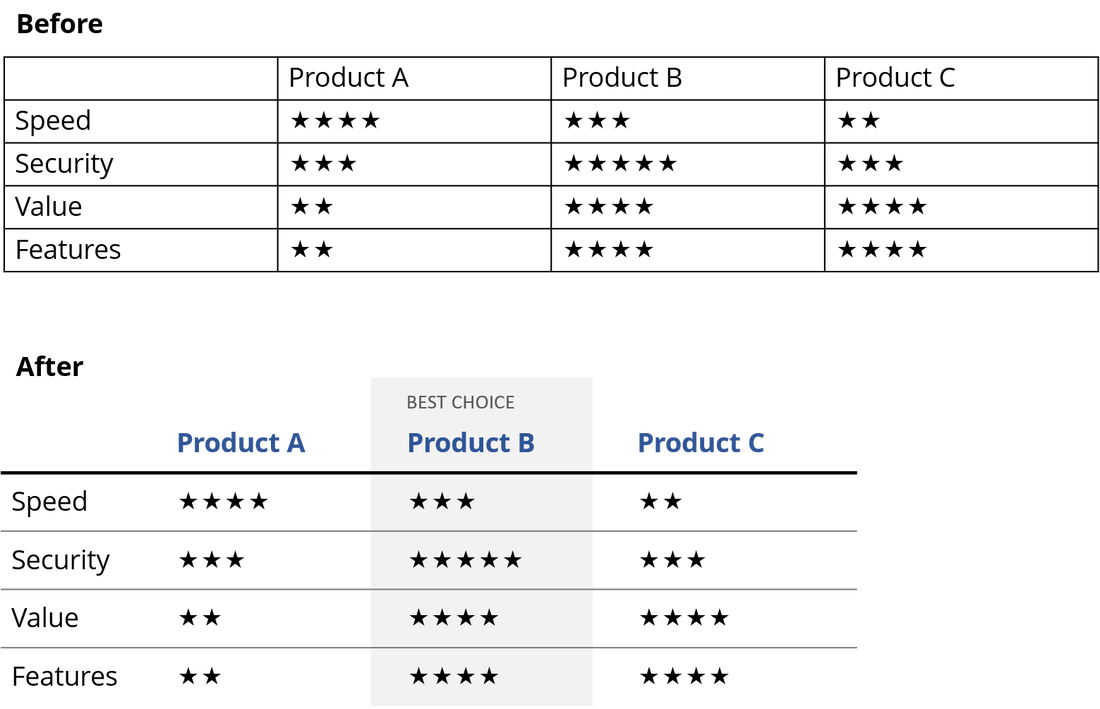
Do you deal with a lot of data? Take a look at how I converted an ordinary chart into a minimal, visually appealing chart that tells a story.

Picture

For additional help with data visualization, check out Cole Nussbaumer Knaflic's blog Storytelling with Data. I also recommend her book with the same title.

www.storytellingwithdata.com
Picture
0 Comments
    For anyone interested, I have a personal blog titled My Journey to Know the Savior where I share reflections about Jesus Christ.

    Categories

    All
    Accessibility
    Activities
    Animation
    App Design
    Articulate Rise
    Articulate Storyline
    Bootstrap
    Captivate
    Data Visualization
    Development
    Engagement
    Fonts
    Graphic Design
    Illustrations
    Inspiration
    Instructional Design
    Learning Objectives
    PDF
    Portfolio
    Powerpoint
    Screencasts
    Software Simulation
    Stock Photography
    Templates
    Tools
    Tutorials
    Videos
    Web Design
    Whiteboard

Powered by Create your own unique website with customizable templates.
  • Blog
  • Portfolio